Addis Ababa, Ethiopia · Live monitoring network
Addis Ababa air quality, made visible.
See what Addis Ababa is breathing with real-time measurements from … monitoring stations across the city.
Addis Ababa right now
—
AQI
Listening…
Pulling the latest readings from monitoring stations across the city…
Mean across reporting stations · latest reading · Waiting for a recent reading · US EPA AQI
The network
The city, station by station.
Explore live PM2.5 and PM1.0 readings across Addis Ababa. Select a station to see its latest measurements, or compare conditions using US EPA, European EAQI, UK DAQI, and WHO 2021 guidance.
Built for the streets of Addis Ababa.
Each station brings sensing, power, connectivity, and a weather-resistant enclosure into one field-ready unit. The same care that goes into the data starts at the board and continues through installation above the traffic it measures.
PCB
A compact sensing and communications stack collects particulate matter and environmental readings continuously.
Mechanical
The ventilated enclosure protects the electronics while allowing representative airflow at street and rooftop installations.
Designed, assembled, and deployed locally
PCB stack & routing
Hardware view 1 / 3
A closer look at every station.
Scan the latest particulate matter and environmental readings across the network, then open any station for its full history.
Pulling the latest readings from all monitoring locations
More than a single number.
Understand the particles in the air, the conditions around them, and how both change over time.
PM1.0 and PM2.5 reveal the small particles that can travel deep into the lungs. Following them helps make invisible exposure easier to understand.
Temperature and humidity add context to every particle reading and help explain how pollution moves through the city.
Choose US EPA, European EAQI, UK DAQI, or WHO 2021 guidance to interpret live PM2.5 readings using a standard you recognize.
Historical readings reveal recurring patterns, unusual events, and the longer-term direction of air quality at each location.
The public view keeps essential measurements clear. Signed-in researchers can explore PM4.0, PM10, particle counts, VOC, NOx, and more.
From the workbench to the street.
Every point on the map began with hands-on work: configuring the electronics, carrying the enclosure into the field, and mounting it above the traffic it measures.
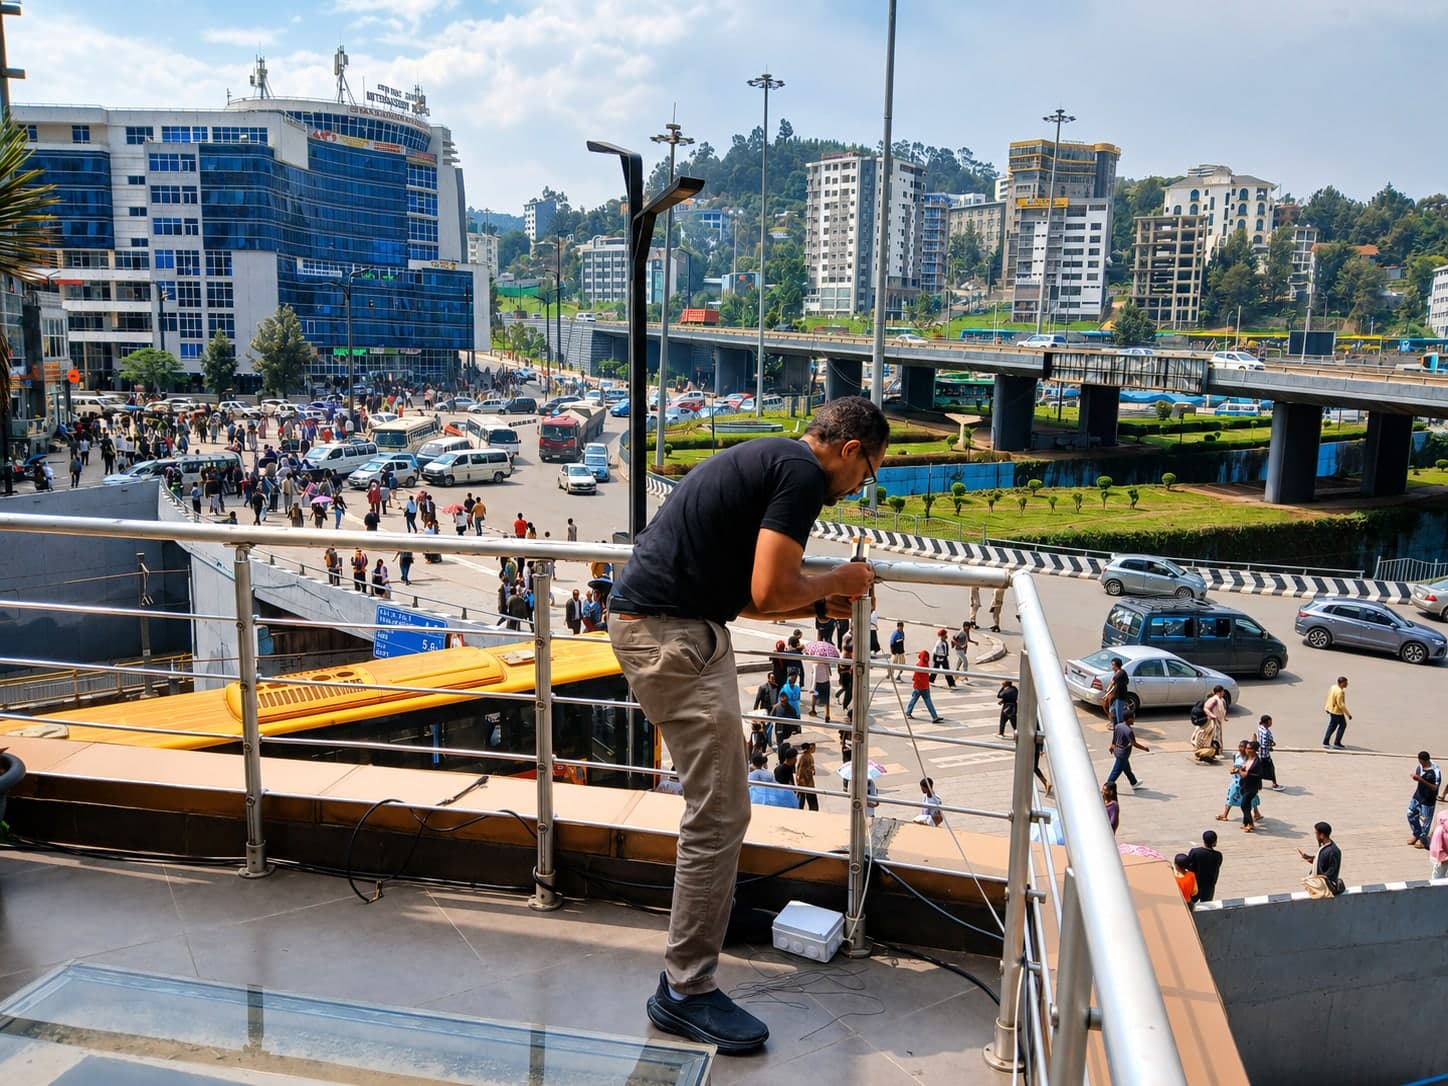 Mounting a station above the traffic it measures
Built by people, not just sensors.
Addis Air Net brings together hardware, calibration, data engineering, and field work to carry each measurement from a sensor on the street to the screen in front of you.
Hardware & sensing
From board to enclosure
Designing, assembling, and maintaining the sensing hardware used across the network.
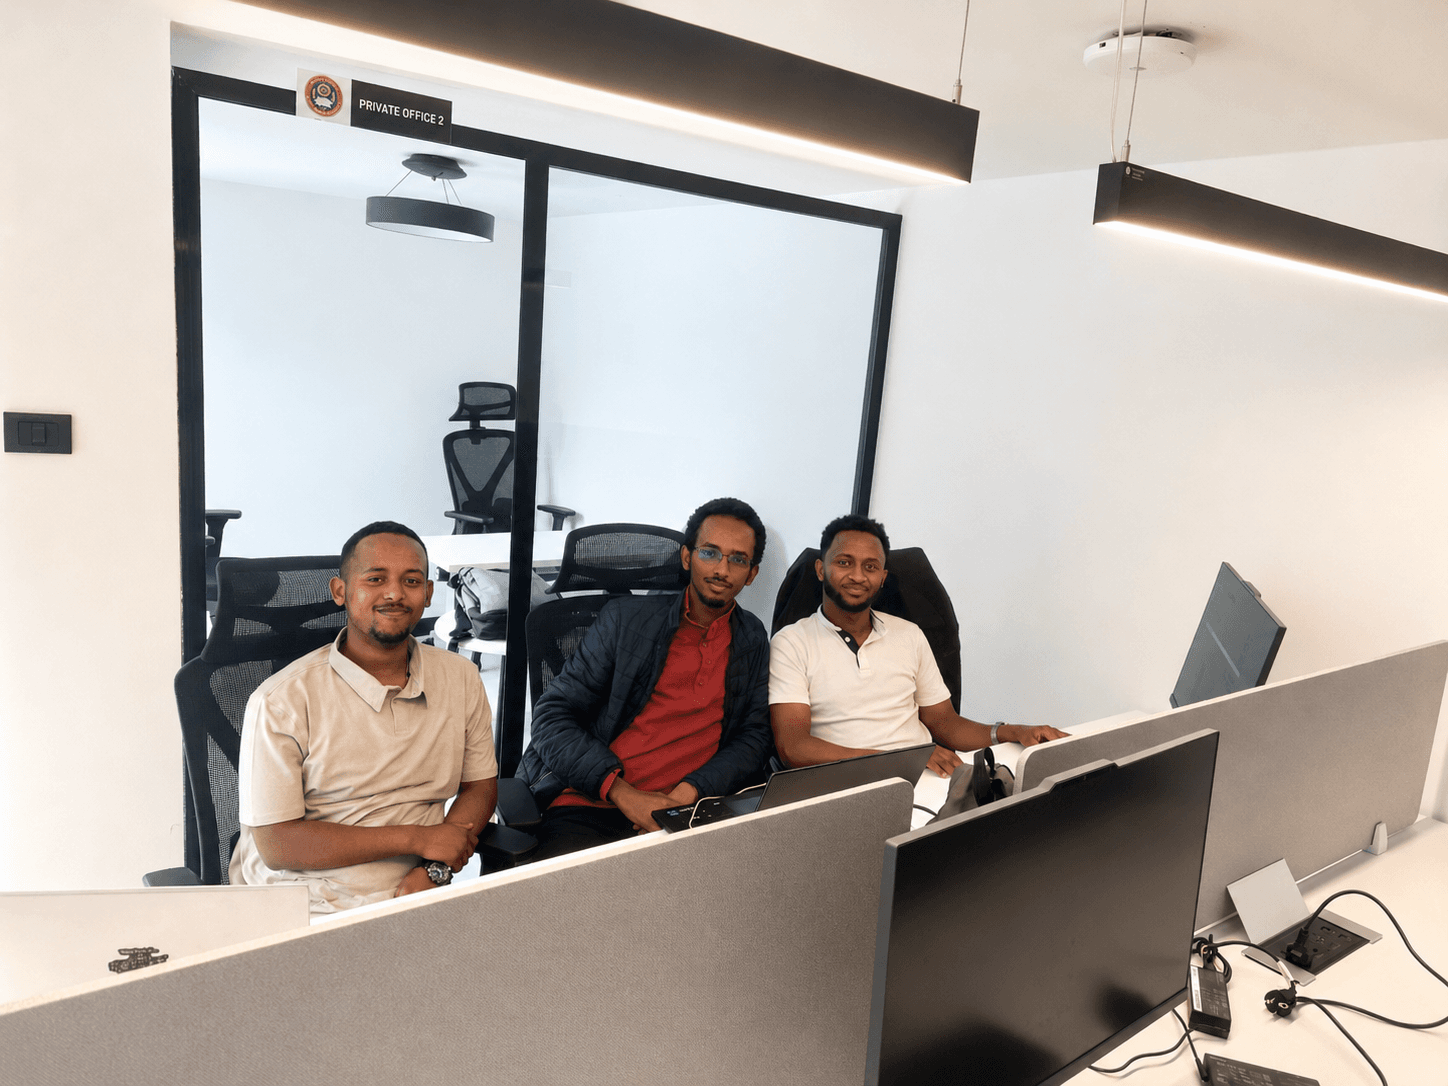
Data & software
From station to screen
Building the data pipeline, quality checks, maps, and tools that turn readings into useful information.
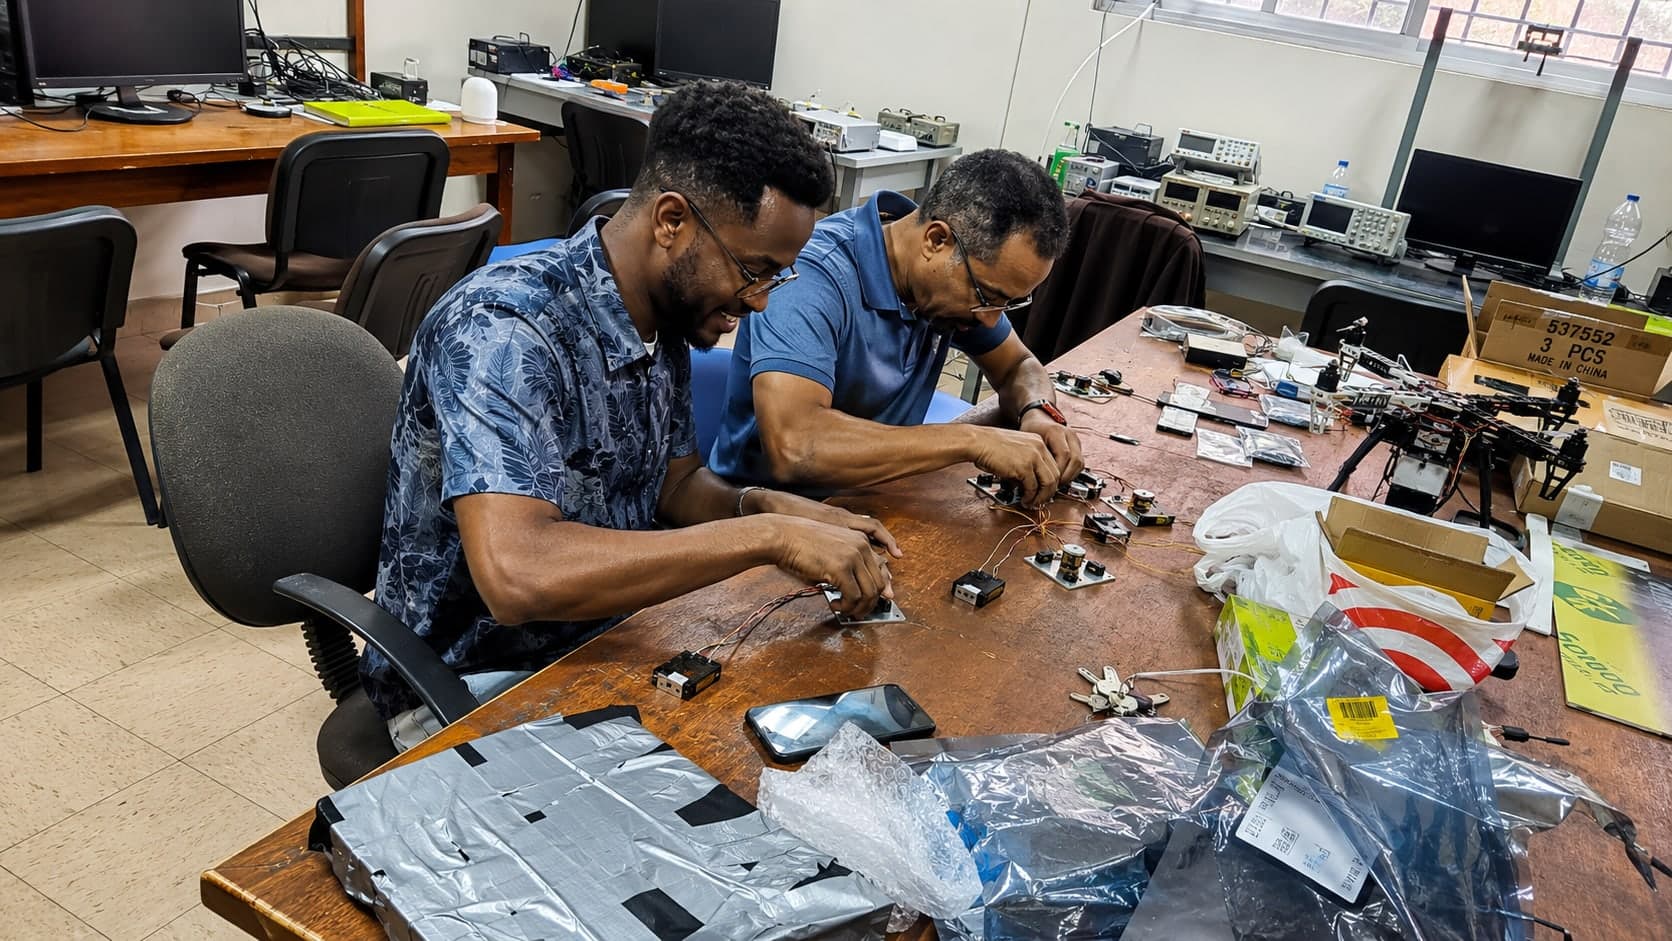
Research & calibration
From measurement to evidence
Testing sensors, reviewing measurements, and strengthening the network's scientific foundation.